1. Adding a Dashboard Item – Benefits Tracking Tile Reporting
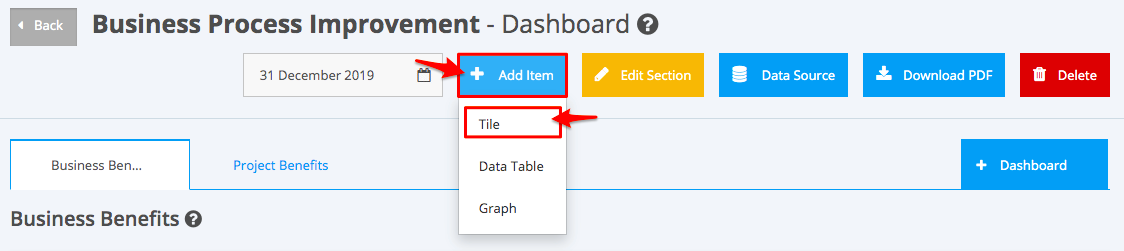
1. In the newly created Dashboard section in the Dashboard tab, click ‘+ Add Item’ and select ‘Tile’ from the drop-down menu.
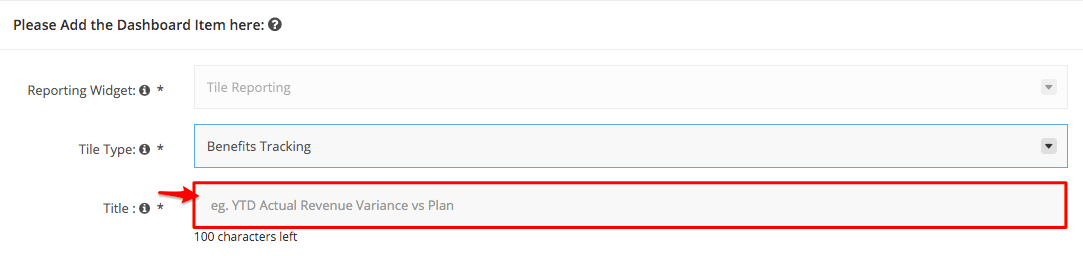
2. In the ‘Dashboard – Add Tile Item’ page, select 'Benefits Tracking' as the ‘Tile Type' from the drop-down list.

3. Add the 'Title' of the Dashboard Tile item. Only 100 characters are allowed for the tile name.
4. Select the ‘Section’ to which the Dashboard Item will be displayed.

5. Select the ‘Benefit Categories’ from which the data of the Benefits will be pulled.

6. Select the ‘Data Type’ from the dropdown list as shown in the image below.

7. Select the ‘Pull Up Type’ from the drop down menu as seen in the image below. This determines how the data will be presented.

8. Select the ‘Weighting Filter’ from the drop-down list.

- Selecting Benefit Project Departments as a weighting filter lets you choose a sub-filter from the Project Departments in the drop-down list provided.
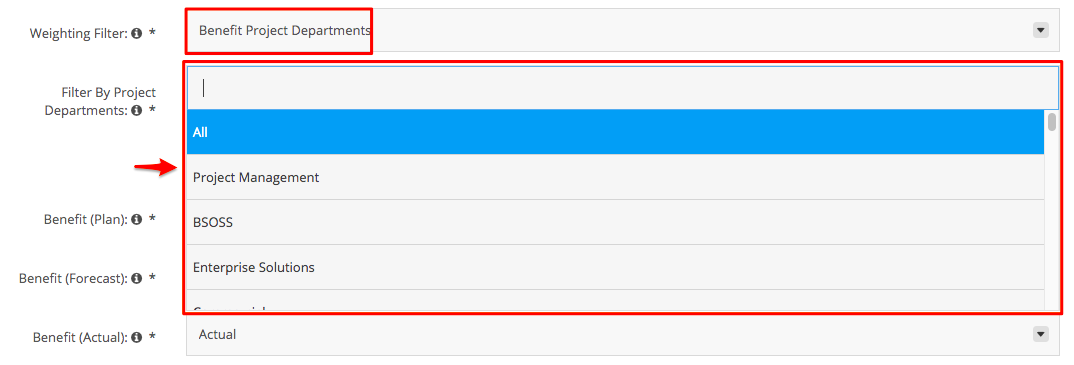
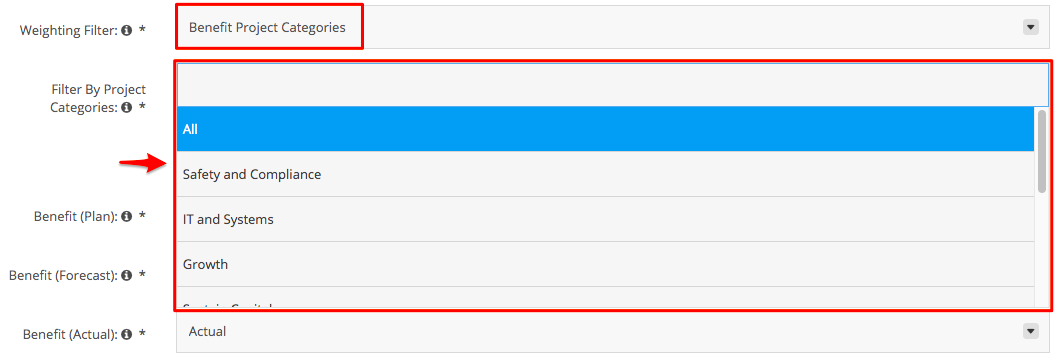
- Selecting Benefit Project Categories as a weighting filter lets you choose a sub-filter from the Project Categories in the drop-down list provided.
9. Set the Benefit 'Plan', 'Actual', and 'Forecast' from the drop-down list provided.

10. Add a 'Criteria' to test the output of the data if it met the standards being raised. 
11. Add the 'Acceptable Band' to display a target of the data that will be displayed once the tile item has been generated.

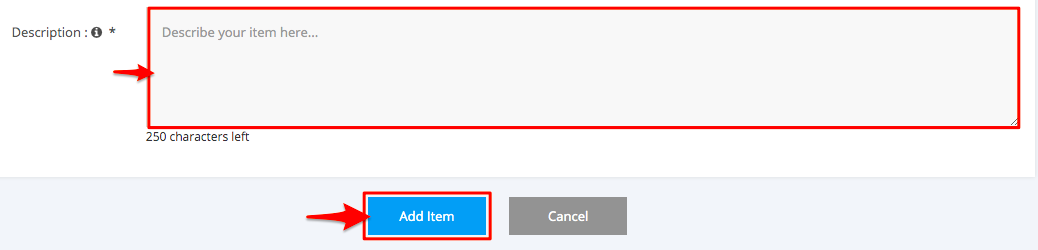
12. Add a brief 'Description' limited to 250 characters for the tile item. Once all the pre-requisite data has been accomplished, click the ‘Add Item’ button.