1. Navigate Cost Performance Chart
Within the Project Overview module, navigate to the ‘Cost Performance Chart’.
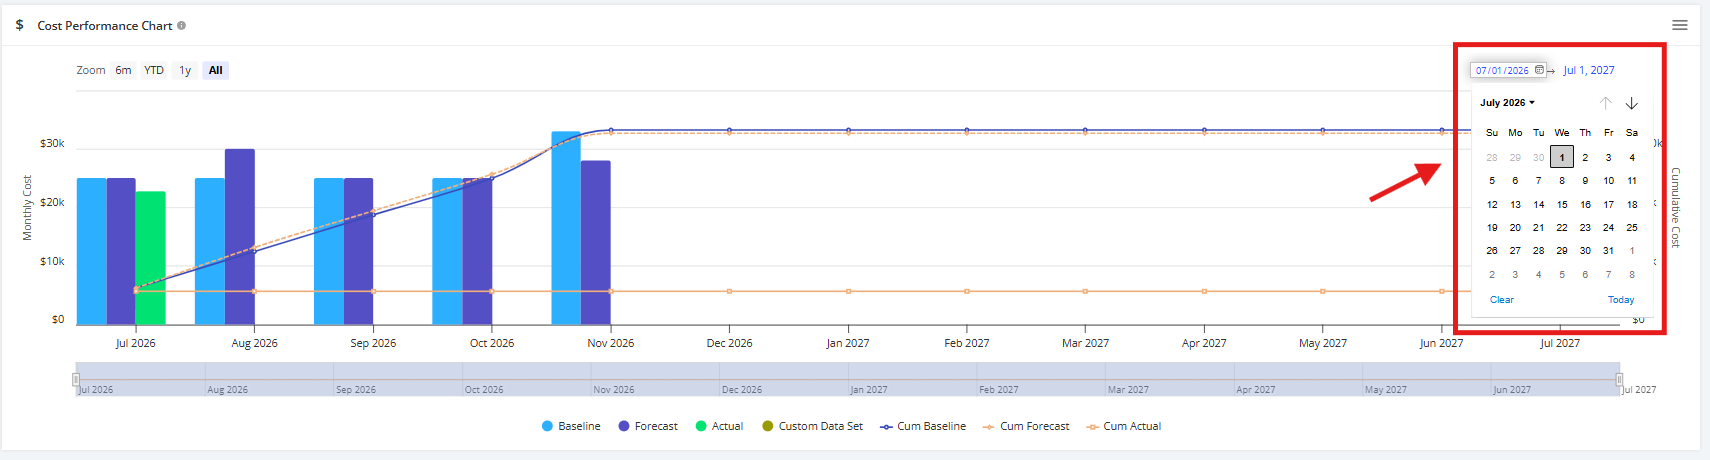
‘Cost Performance Chart‘ can filtered by the following options:
- Click ‘6m’ to view the project cost details in 6 months
- Click ‘YTD’ to view the project cost details from the start of the project to current date
- Click ‘1Y’ to view the project cost details in 1 year
- Click ‘All’ to view the project cost details from start of the project up to the end of the project
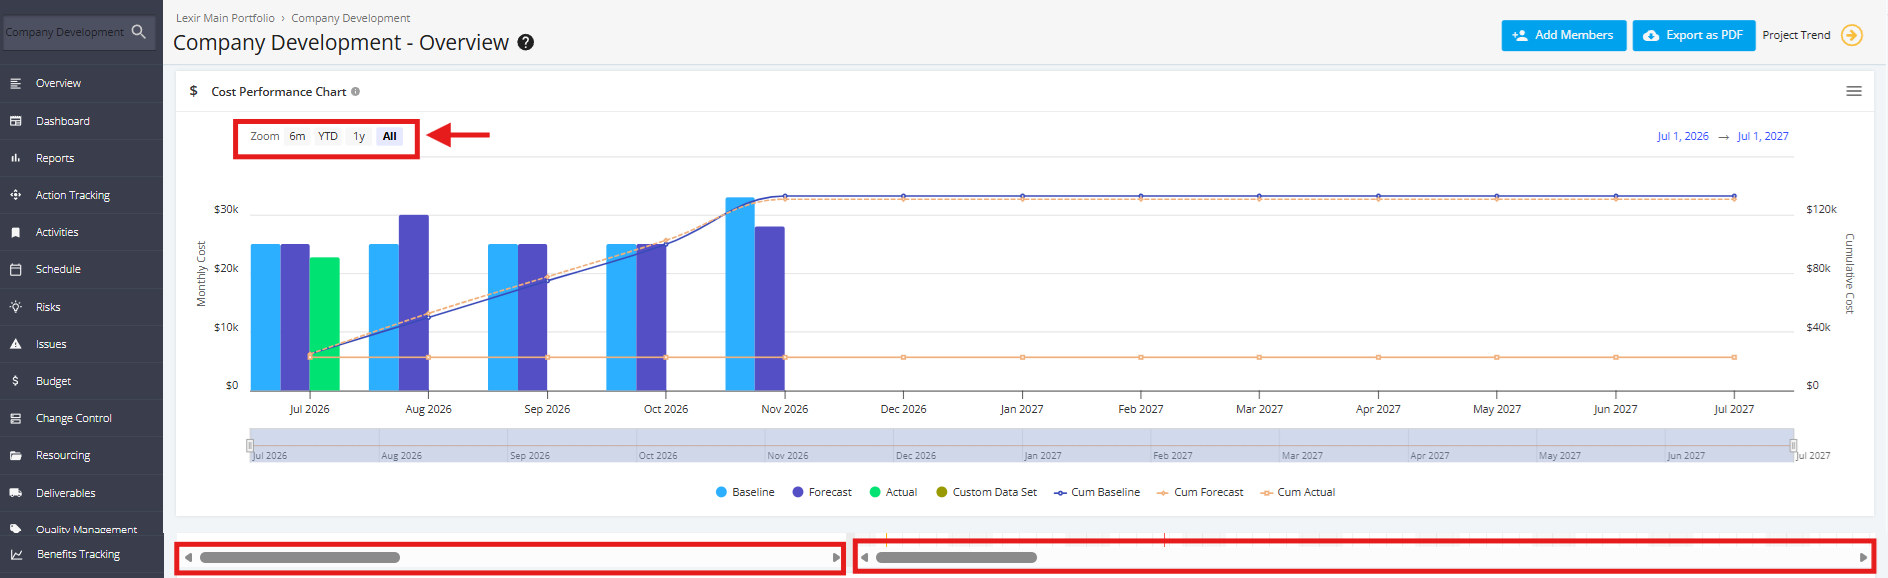
Note: Overview page is only for viewing. Cost Performance Chart can be managed via Budget page.
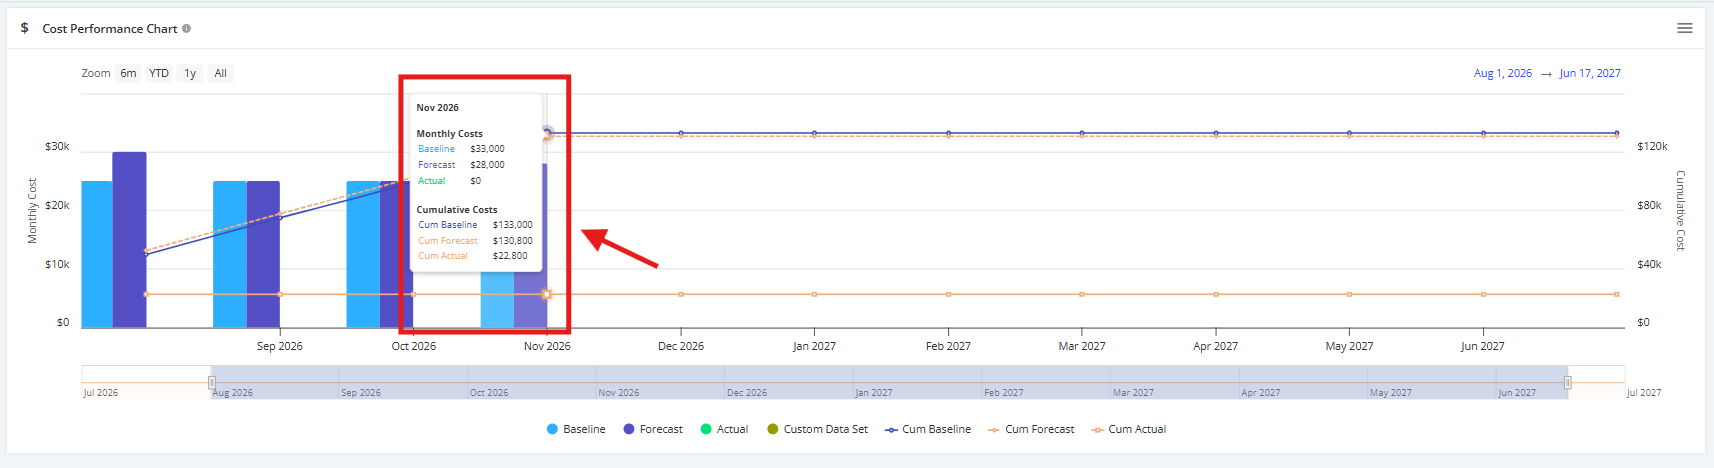
You can hover over the bar graph to view the Budget Details.
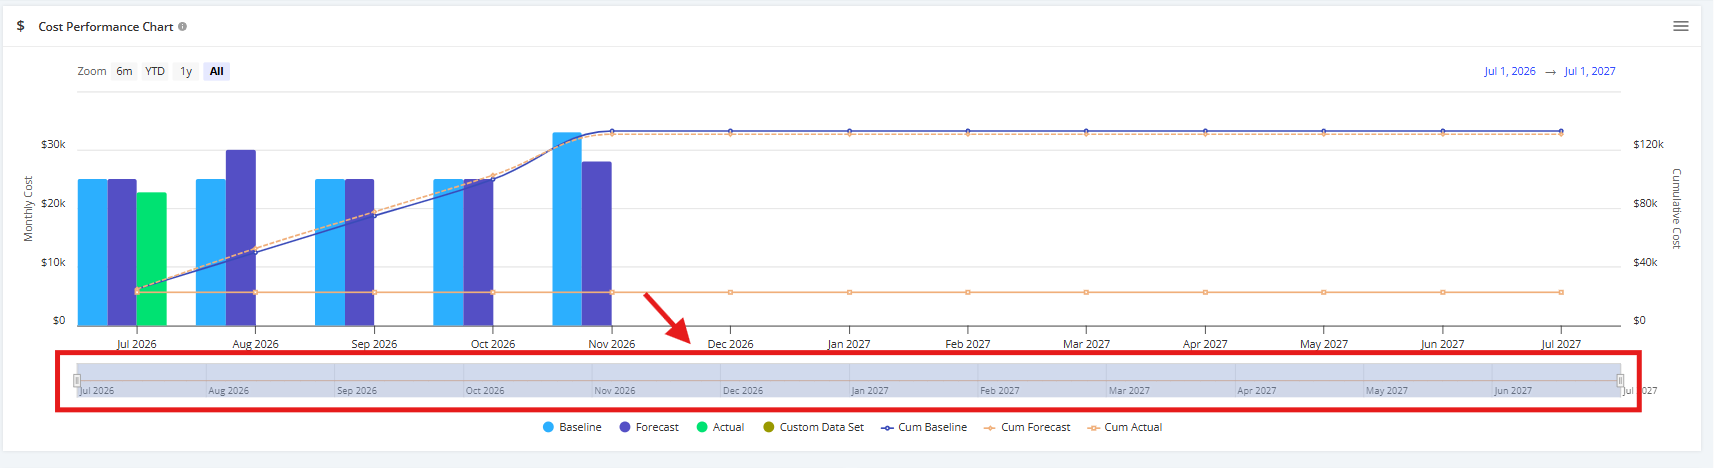
You can also use the range slider showing the full project timeline. Use it to zoom into a specific period:
- Drag the left handle to adjust the start date of the visible range.
- Drag the right handle to adjust the end date.
- Click and drag the shaded area between the handles to shift the entire range without changing its length.
The main chart above will automatically update to reflect your selected date range.
You can configure the view of the Cost Performance Chart via the Calendar Selector. To do this, click the Start or end date field above the chart, then select a date from the calendar that appears. Use the arrows or month label to navigate to a different month or year.
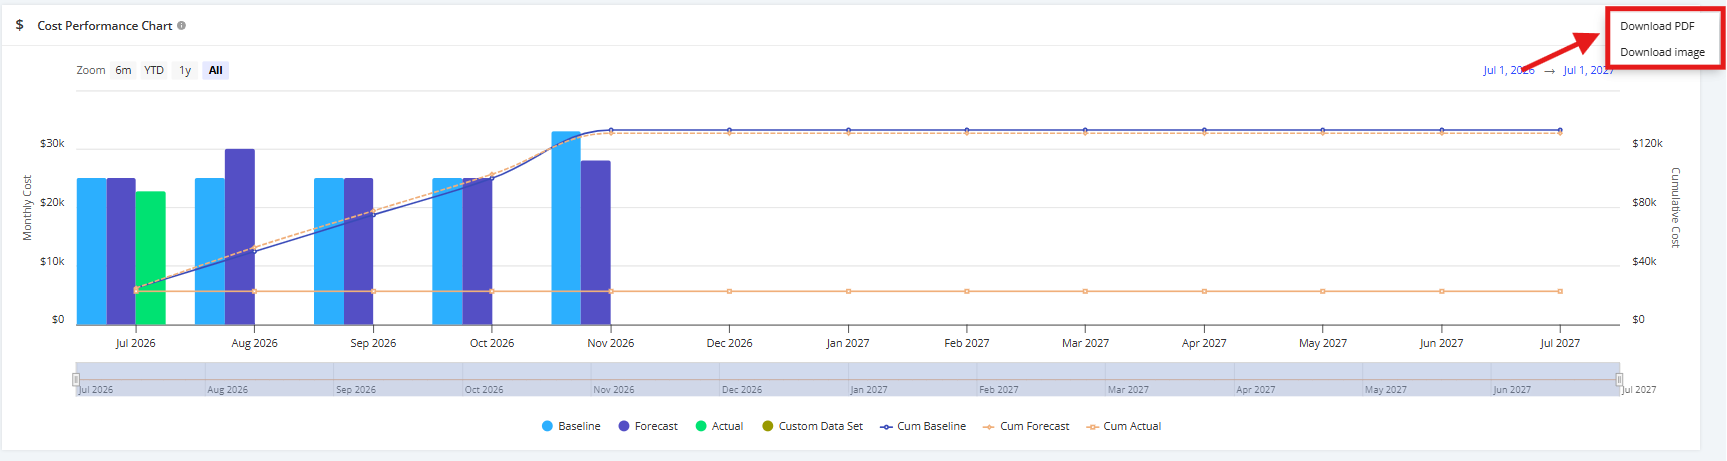
You can download the Cost Performance Chart by clicking the ‘Download’ icon.
Once done, choose the kind of file to download: ‘Download PDF’ or ‘Download Image’.