1. Reporting Data Display for Project Schedule
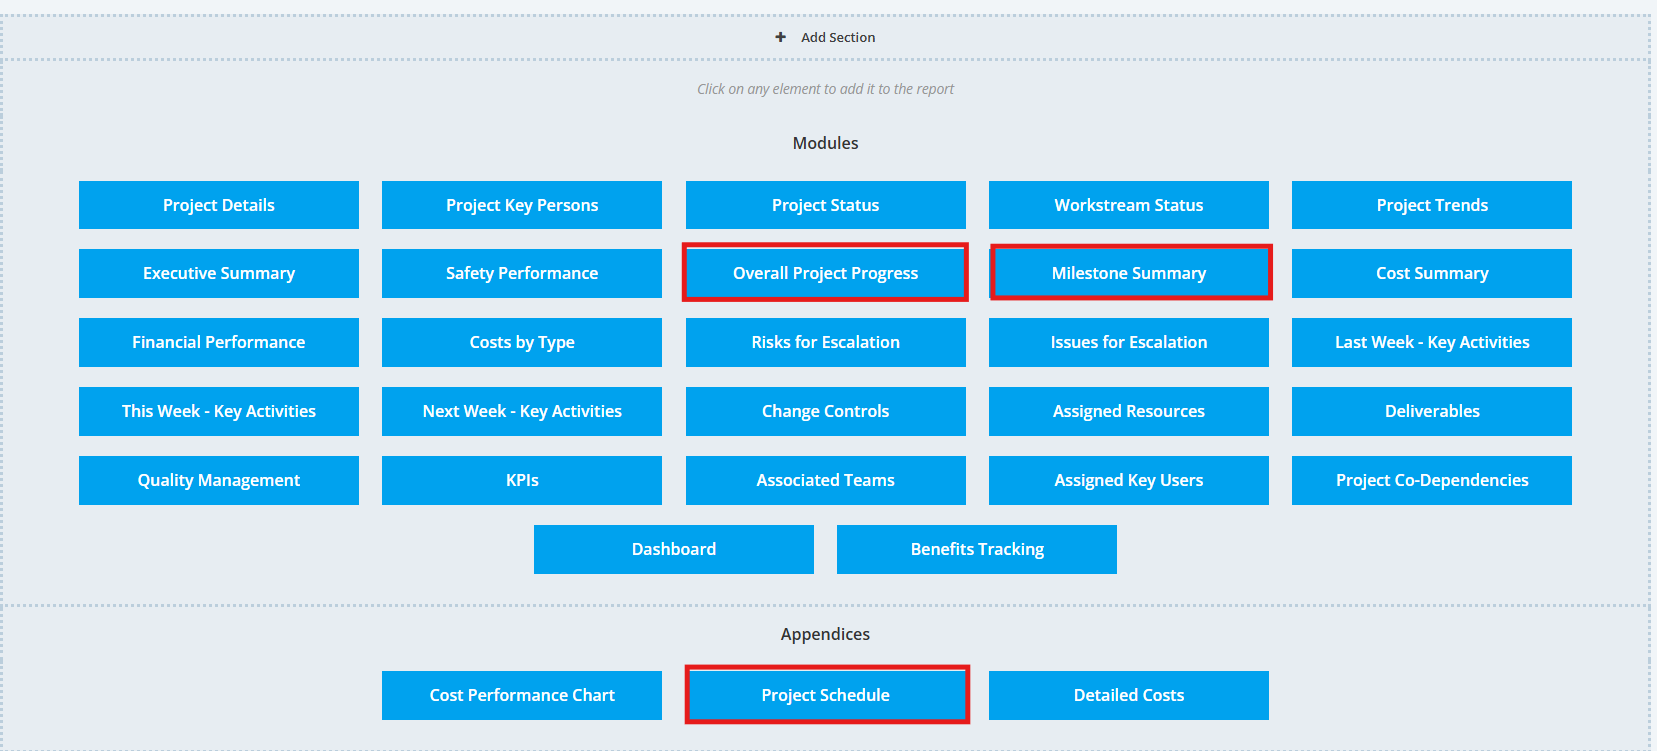
The Report has 3 Modules to view Schedule Data:
- Overall Project Progress
- Milestone Summary
- Project Schedule
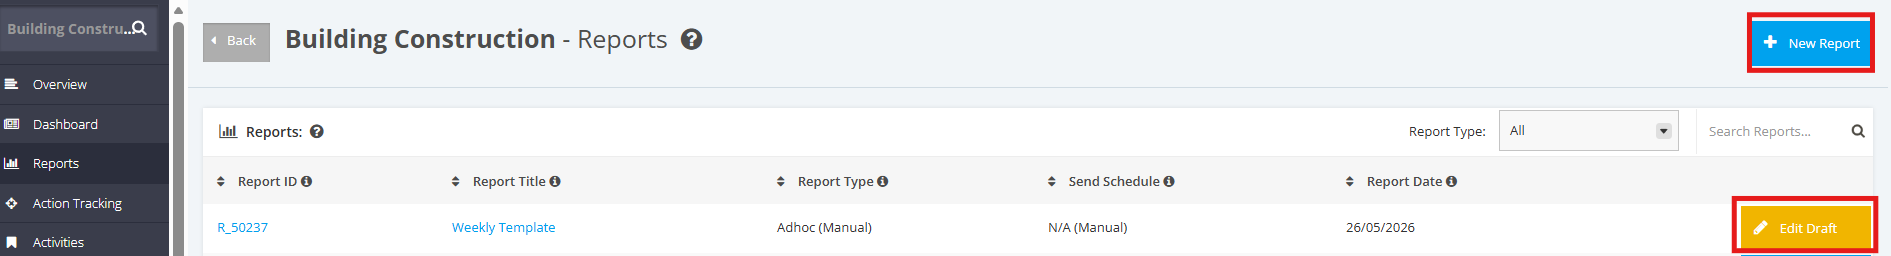
1. To view schedule data in the status report, In the ‘Project Dashboard’ section, click on the ‘Name’ of the ‘Project’ that you want to manage. Once a project is selected, Click ‘’Reports” tab from the sidebar
2. To view Schedule data, either select existing report in draft mode or create a new report and ensure that the 3 modules are included.
Refer Manage Project Report Template for creating new reports.
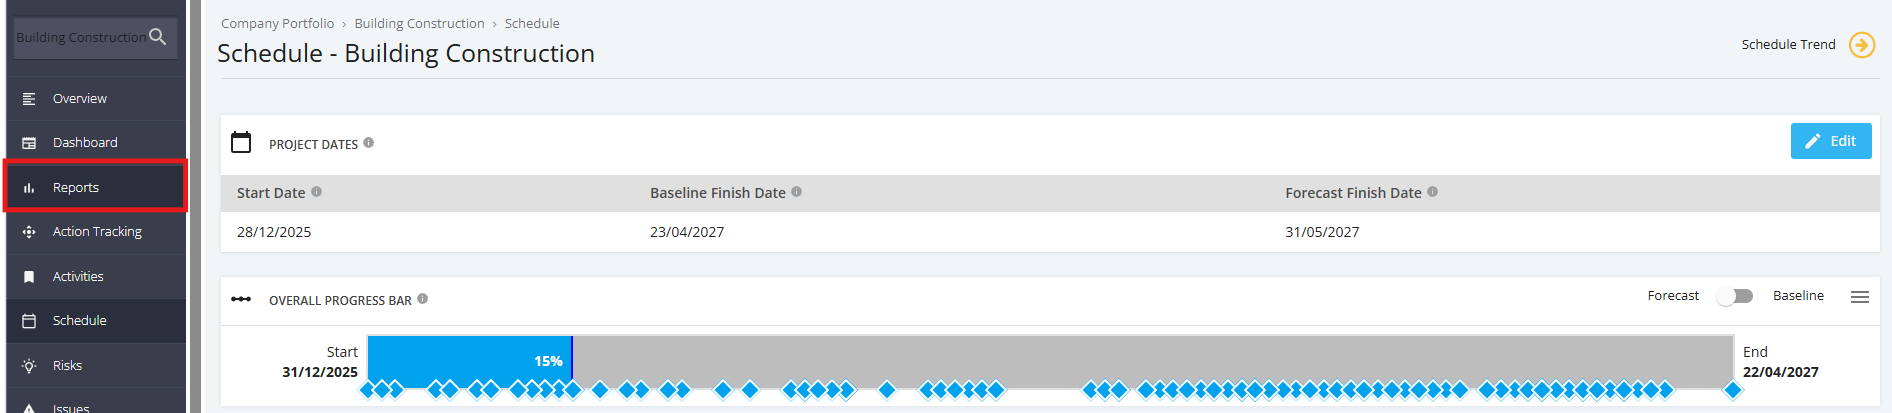
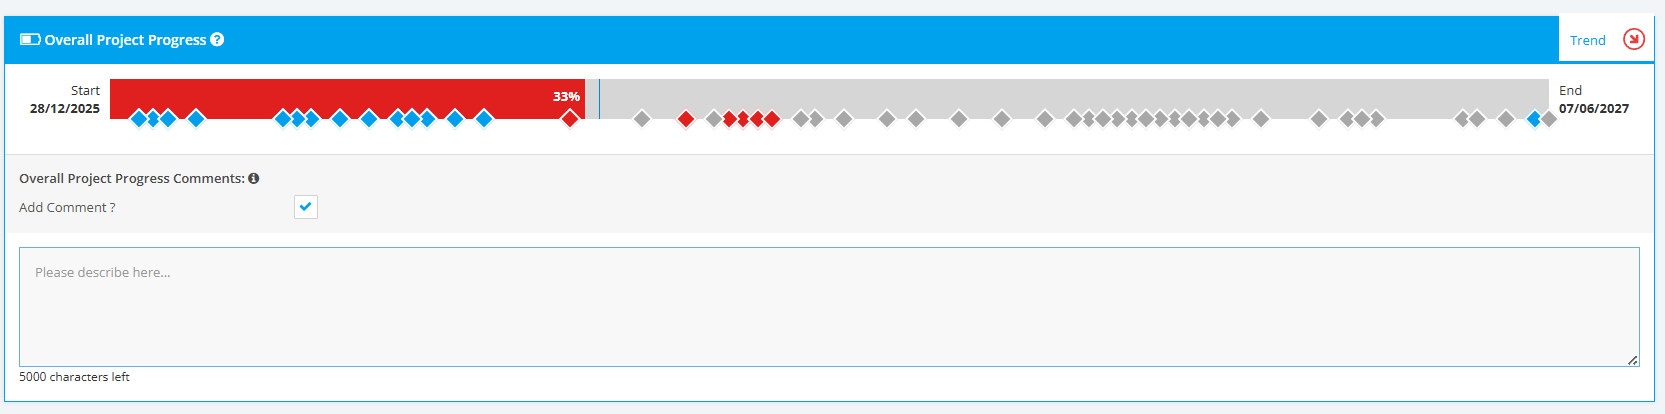
3. Navigate to the Overall Project Progress section. You will see the Overall Project Progress Bar as displayed in the Schedule module.
Note that “Actual to Date" is tracking against “Planned to Date” based on the Project Start and Forecast End dates.
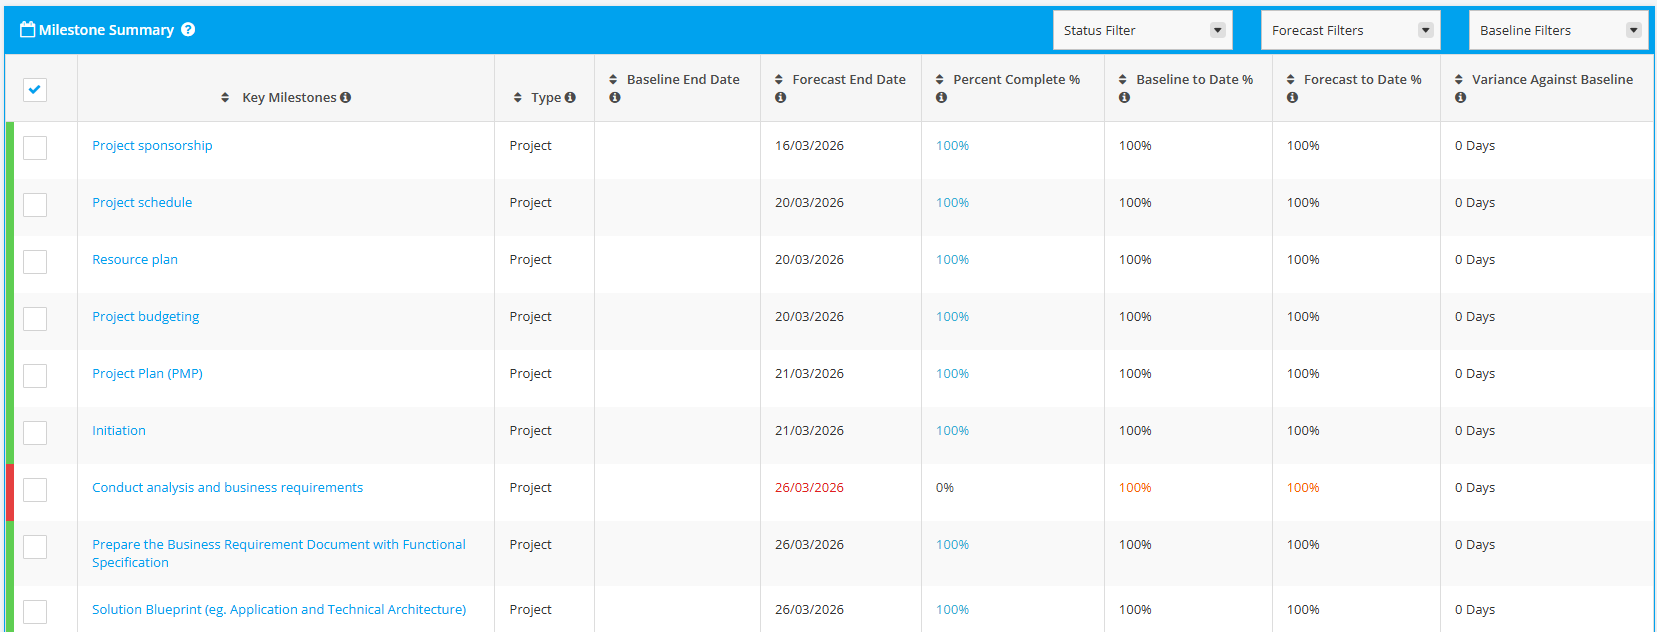
4. Navigate to the Milestone Summary section. It provides an overview of the progress of the milestones against dates and planned percentage. All milestones (Project and Portfolio) will be automatically displayed in this table.
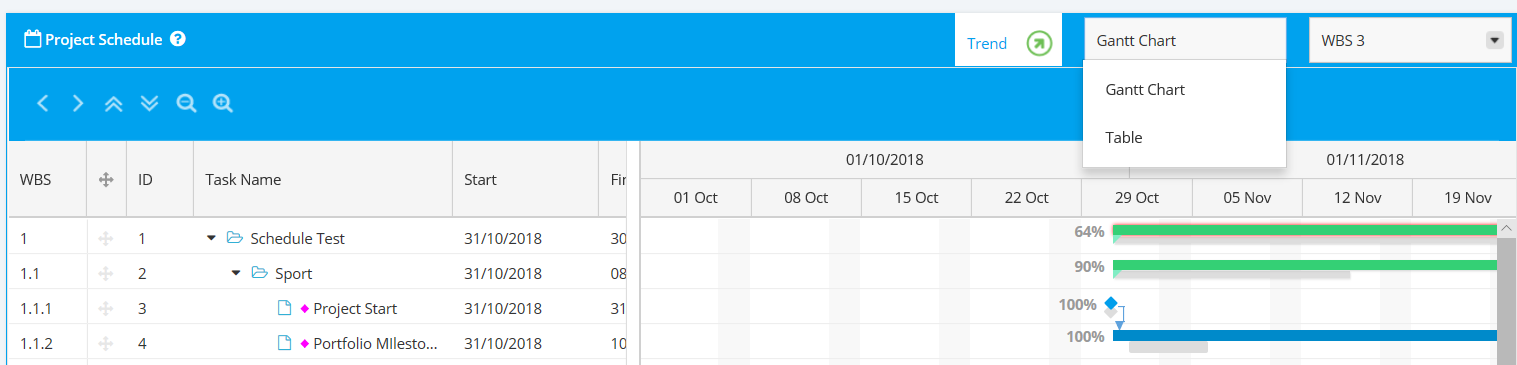
5. Navigate to the Project Schedule appendix. User has the option at the individual report level to override the default Project Settings via the dropdown options in the top righthand corner of the said section.
- Gantt View – select between WBS level 1 – 12(All)
- Table View – no filters table will output WBS 12(All)
For All Modules:
Comments can be added within the comment field.
You can also untick the Add Comment flag should you not want to add such, and Comment box will be hidden.
