1. Project Schedule Status
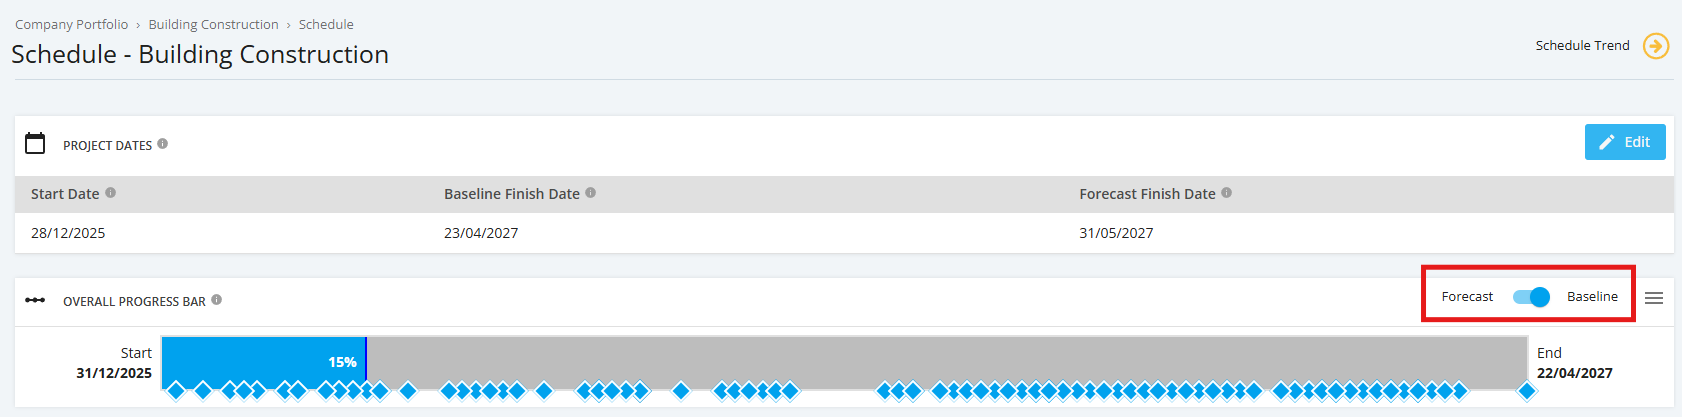
The Overall Progress Bar provides a guide on how the Project Schedule “Actual to Date” is tracking against “Planned to Date” based on the Project Start and Forecast End dates (by default).
The Project Schedule progress calculation is based on comparing actual and planned percentage of days completed for the project. The score is displayed in the pop-up message when a user hovers over the Overall Progress Bar and is reflected as a % score.
Schedule task Colour display and reasons | |
Green | Actual % complete is tracking ‘Ahead’ of Planned Progress |
Blue | Actual % complete is tracking ‘Equal’ to Planned Progress |
Red | Actual % complete is tracking ‘Behind’ Planned Progress |
1. To navigate to the ‘Overall Progress Bar’, click the ‘Schedule’ tab from the sidebar then navigate to ‘Overall Progress Bar’. A box will appear with project details if a user hovers over the bar.
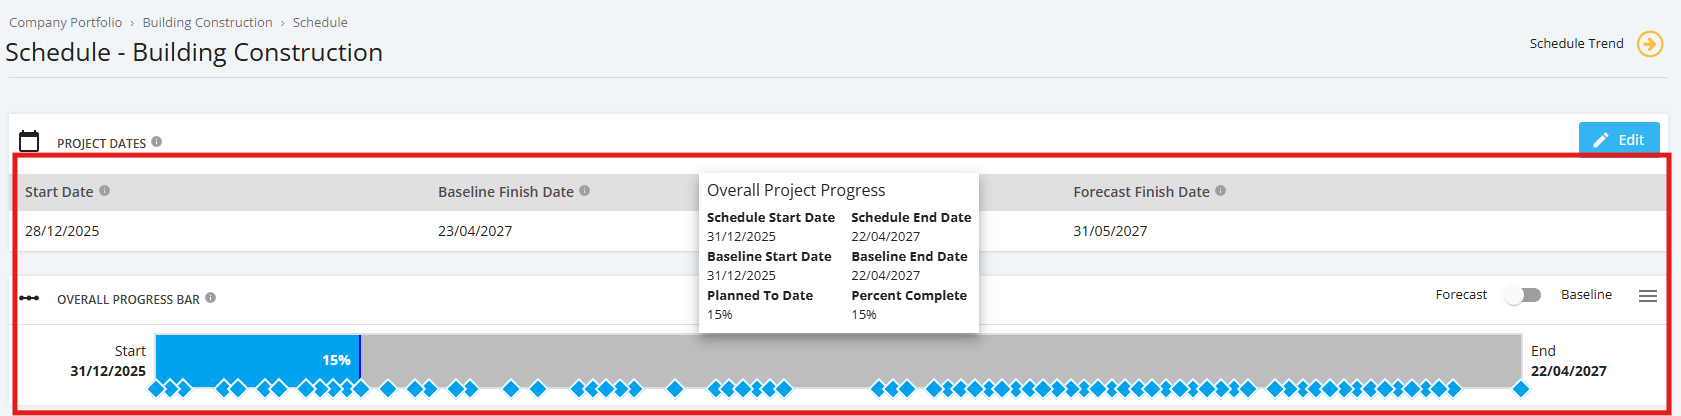
2. Project Milestones are displayed in the Overall Project Progress status bar.
Portfolio Milestones are displayed in the Overall Project Progress Status Bar and also appear in the Portfolio Pipeline Chart.
3. The Project milestones status is displayed based on the following colour legend
Milestone Colour display and reasons | |
Green | Actual % complete is tracking ‘Ahead’ of Planned Progress |
Blue | Actual % complete is tracking ‘Equal’ to Planned Progress or as completed |
Red | Actual % complete is tracking ‘Behind’ Planned Progress |
Grey | Future date and not started |
4. You can change the view of the Overall Progress Bar where “Actual to Date” is tracking against “Planned to Date” based on the Project Start and Baseline End dates. Click the toggle on the rightmost corner of the Overall Progress Bar, and you should expect to view the project progress based on the said dates.