1. Project Schedule Gantt Chart
Once a project has moved into Execution phase the project baseline start and end dates are set. During the lifecycle of the project, Forecast Finish Date can be changed based on customers methodology on who has approval to change the date.
Baseline Finish date can only be updated via Approved Change Request and an updated plan imported via CSV file.
Below is the legend of the colours applied
Colour | Task Bars | Milestones |
Grey | Baseline dates (summary and child) | Baseline/Future dated |
Blue | Actual/Forecast Child Task | Milestone 100% or equal planned to date % |
Green | Actual/Forecast Summary/Parent | Milestone tracking ahead of planned to date % |
Red | Red border identifies task delayed as per planned % complete | Milestone delayed - tracking behind planned to date % |
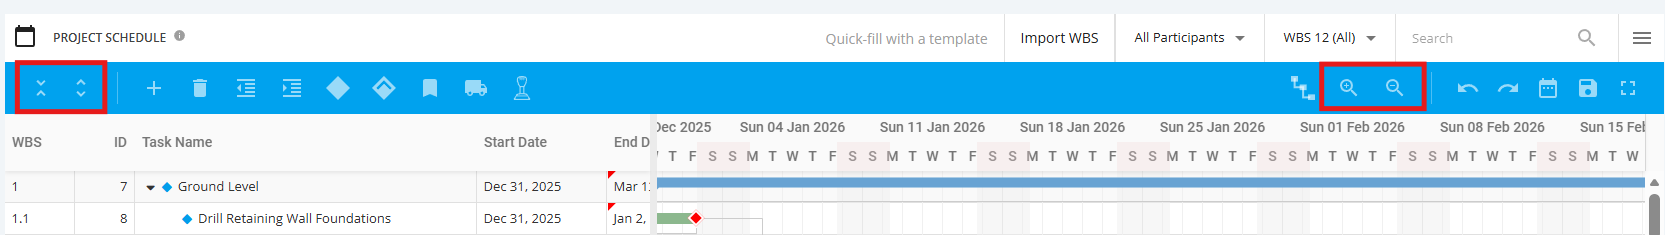
- To navigate to the ‘Project Schedule Gantt Chart’, click ‘Schedule’ Module from the sidebar then navigate to ‘Project Schedule’. The Gantt Chart is located to the right of the Schedule Task list.
- The user can also choose the display in the Gantt Chart section via the toolbar
- Expand All / Collapse All
- Zoom In/Out
3. Project schedule tasks can also be changed by drag and drop changes task bar in the Gantt chart. The data in the scheduled grid will be updated based on the changes made via the Gantt. This is done by clicking on the task
- Link to another task
- Relocate task
- Extend task bar to extend end date
- Move if start date is to be changed